Chapter 3 Data sets
3.1 General presentation of the data used in our examples
Four data sets have been simulated, each containing 7 variables:
- 2 baseline confounders (denoted \(L(0)\) in the DAGs):
L0_male, a binary variable indicating the sex of the participant (1 for men, 0 for women);L0_soc_env, a binary variable indicating if the participant has been exposed to a deprived social environment);
- 1 exposure of interest (denoted \(A\) in the DAGs):
A0_PM2.5, a binary variable indicating if the participants had been exposed to a high level of \(\text{PM}_{2.5}\);
- 1 confounder of the mediator-outcome relationship (denoted \(L(1)\) in the DAGs):
L1, a binary variable indicating if the participant is overweight (1 for being overweight, 0 for not being overweight);
- 1 mediator of interest (denoted \(M\) in the DAGs):
M_diabetes, a binary variable indicating if the participant has type 2 diabetes;
- 2 outcomes (denoted \(Y\) in the DAGs):
Y2_death, a binary variable indicating the occurrence of death before 60 years of age (1 if dead, 0 if alive);Y2_qol, a quantitative variable corresponding to a quality of life measurement.
3.2 Data generating mechanisms
The 4 data generating mechanisms used to simulate the data sets are described in chapter 4 of the Expanse “Mediation analysis” report:
- The first two data sets are simulated from a causal model where confounders of the mediator-outcome relationship (\(L(1)\)) are not affected by the exposure \(A\) (Figure 3.1),
- The data set
df1.csvis simulated from the statistical model \(\mathcal{M}_1\), which does not contain any \(A \ast M\) interaction effect on the outcome \(Y\). - The data set
df1_int.csvis simulated from the statistical model \(\mathcal{M}_{1 \ast}\), which contains an \(A \ast M\) interaction effect on the outcome \(Y\).
- The data set
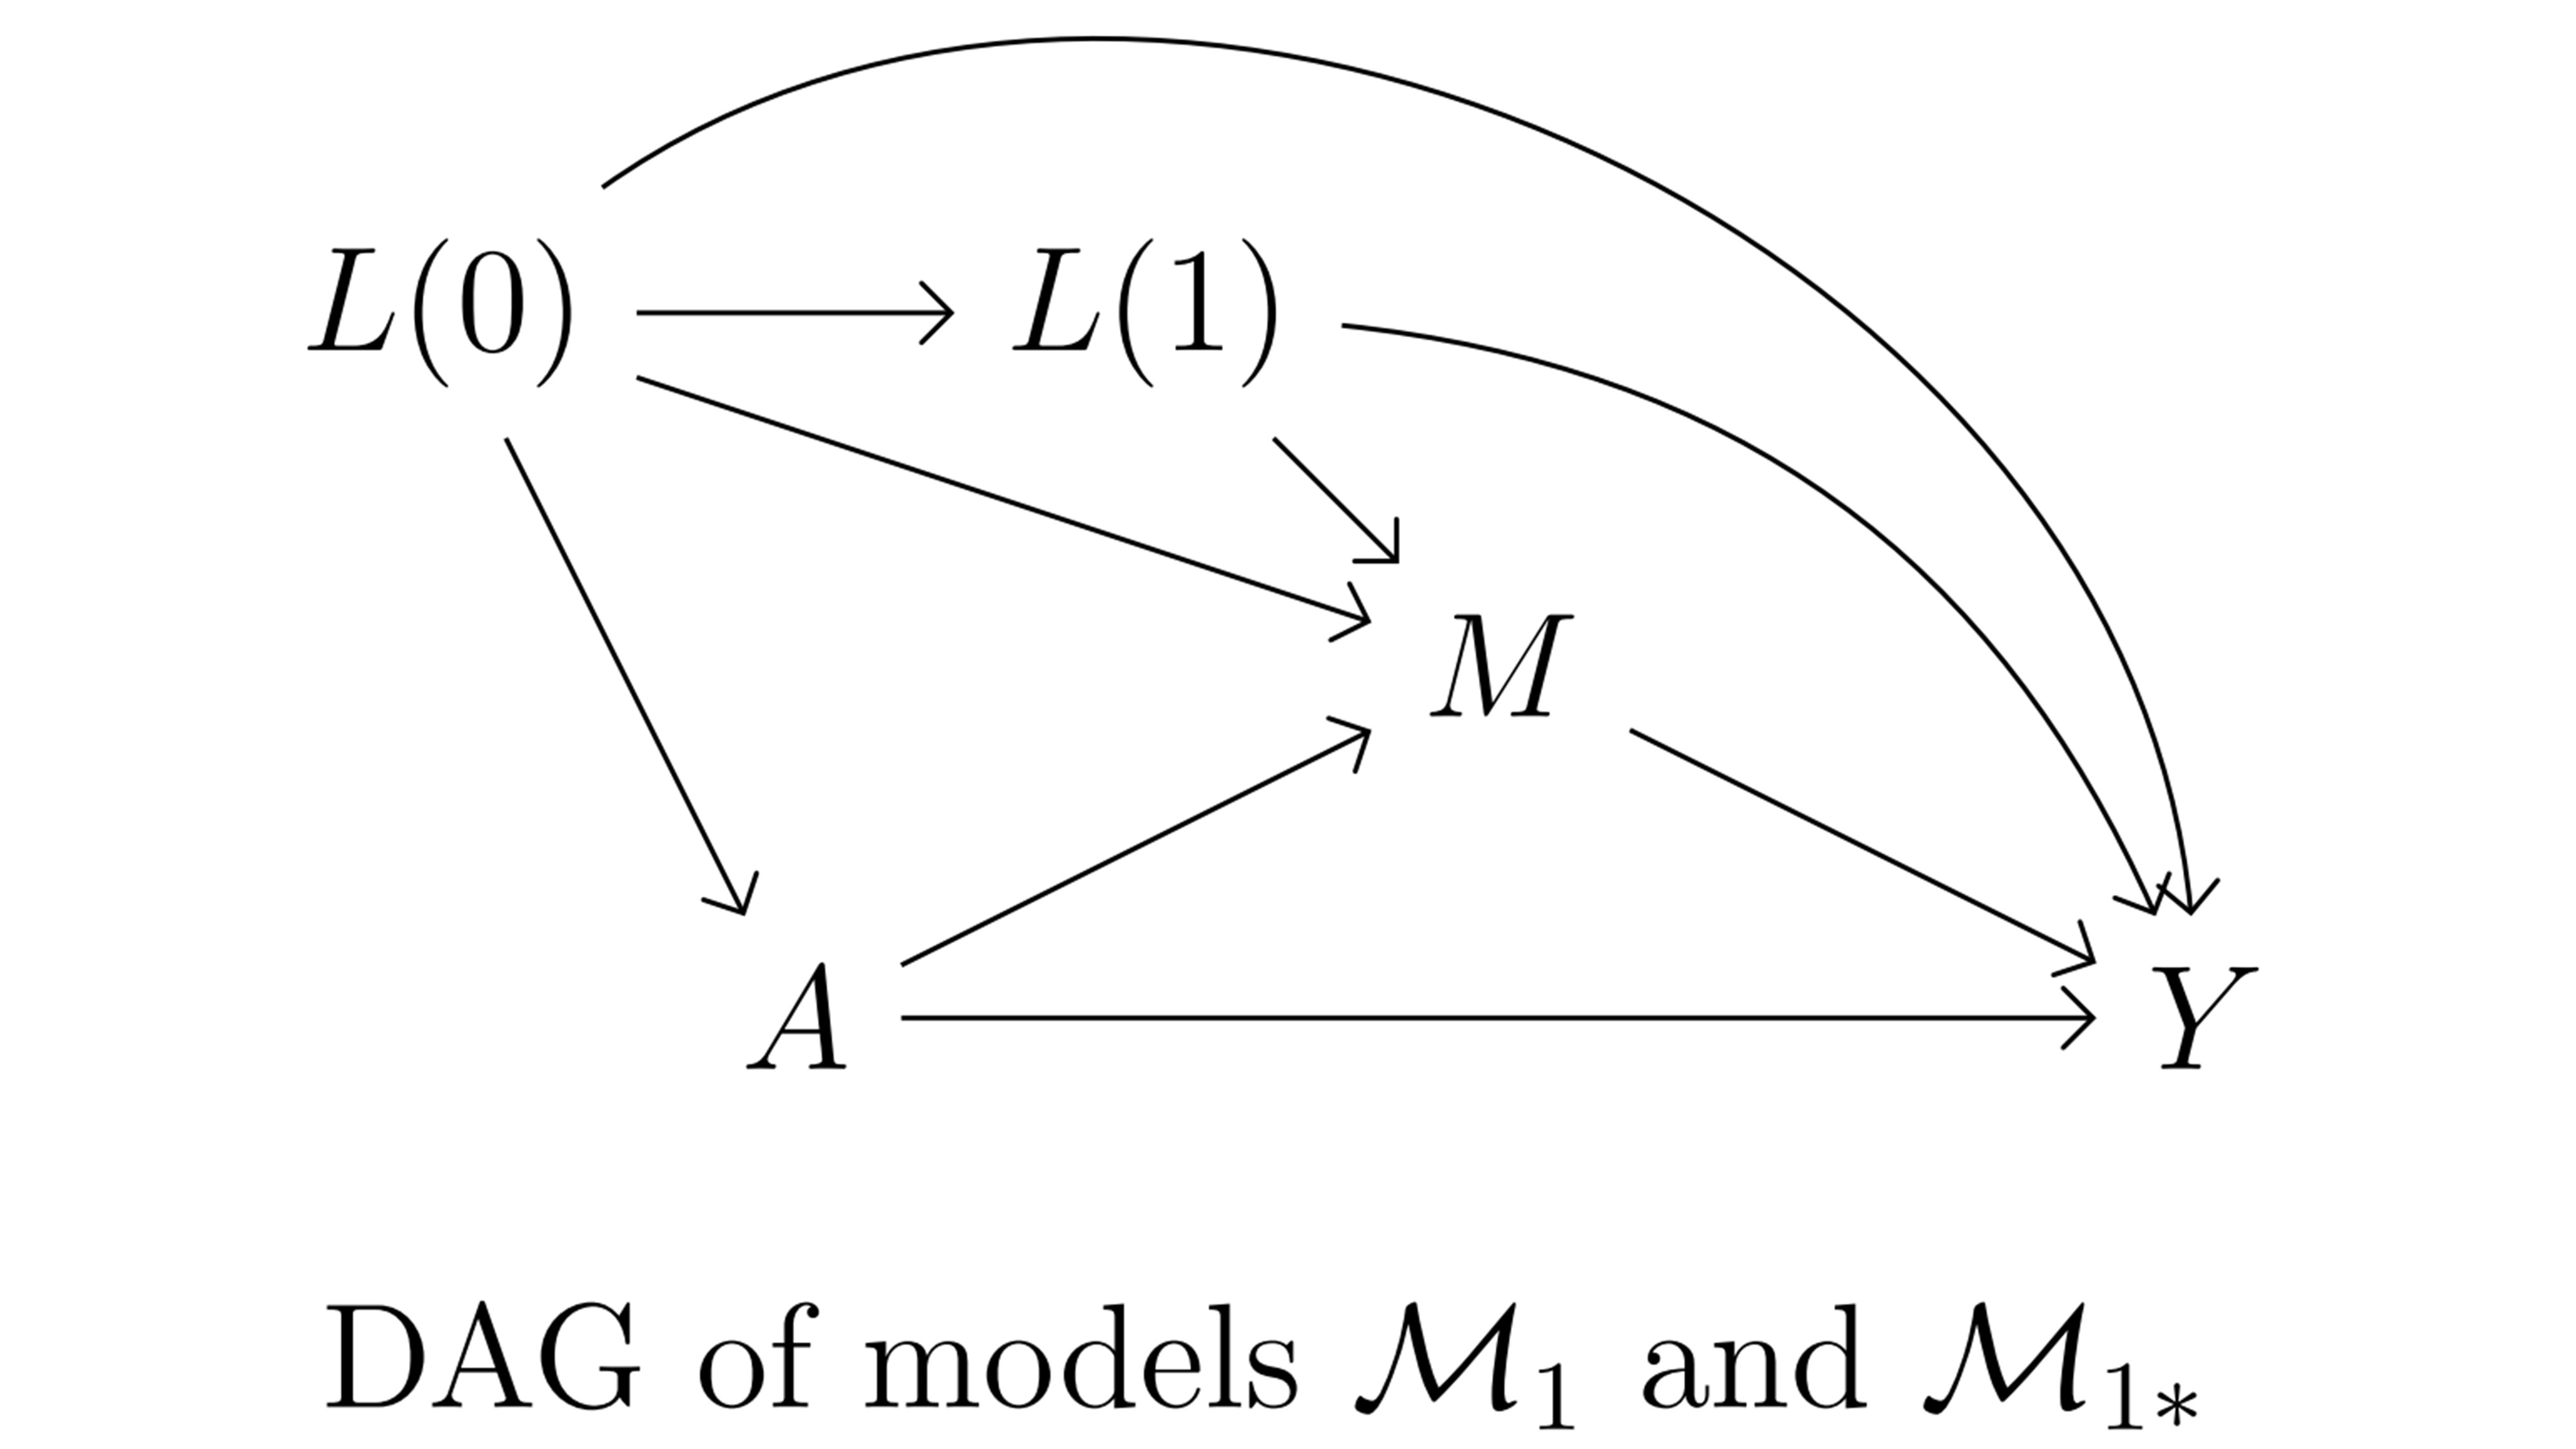
Figure 3.1: Causal model 1
- The next two data sets are simulated from a causal model where confounders of the mediator-outcome relationship (\(L(1)\)) are affected by the exposure \(A\) (Figure 3.2),
- The data set
df2.csvis simulated from the statistical model \(\mathcal{M}_2\), which does not contain any \(A \ast M\) interaction effect on the outcome \(Y\). - The data set
df2_int.csvis simulated from the statistical model \(\mathcal{M}_{2 \ast}\), which contains an \(A \ast M\) interaction effect on the outcome \(Y\).
- The data set
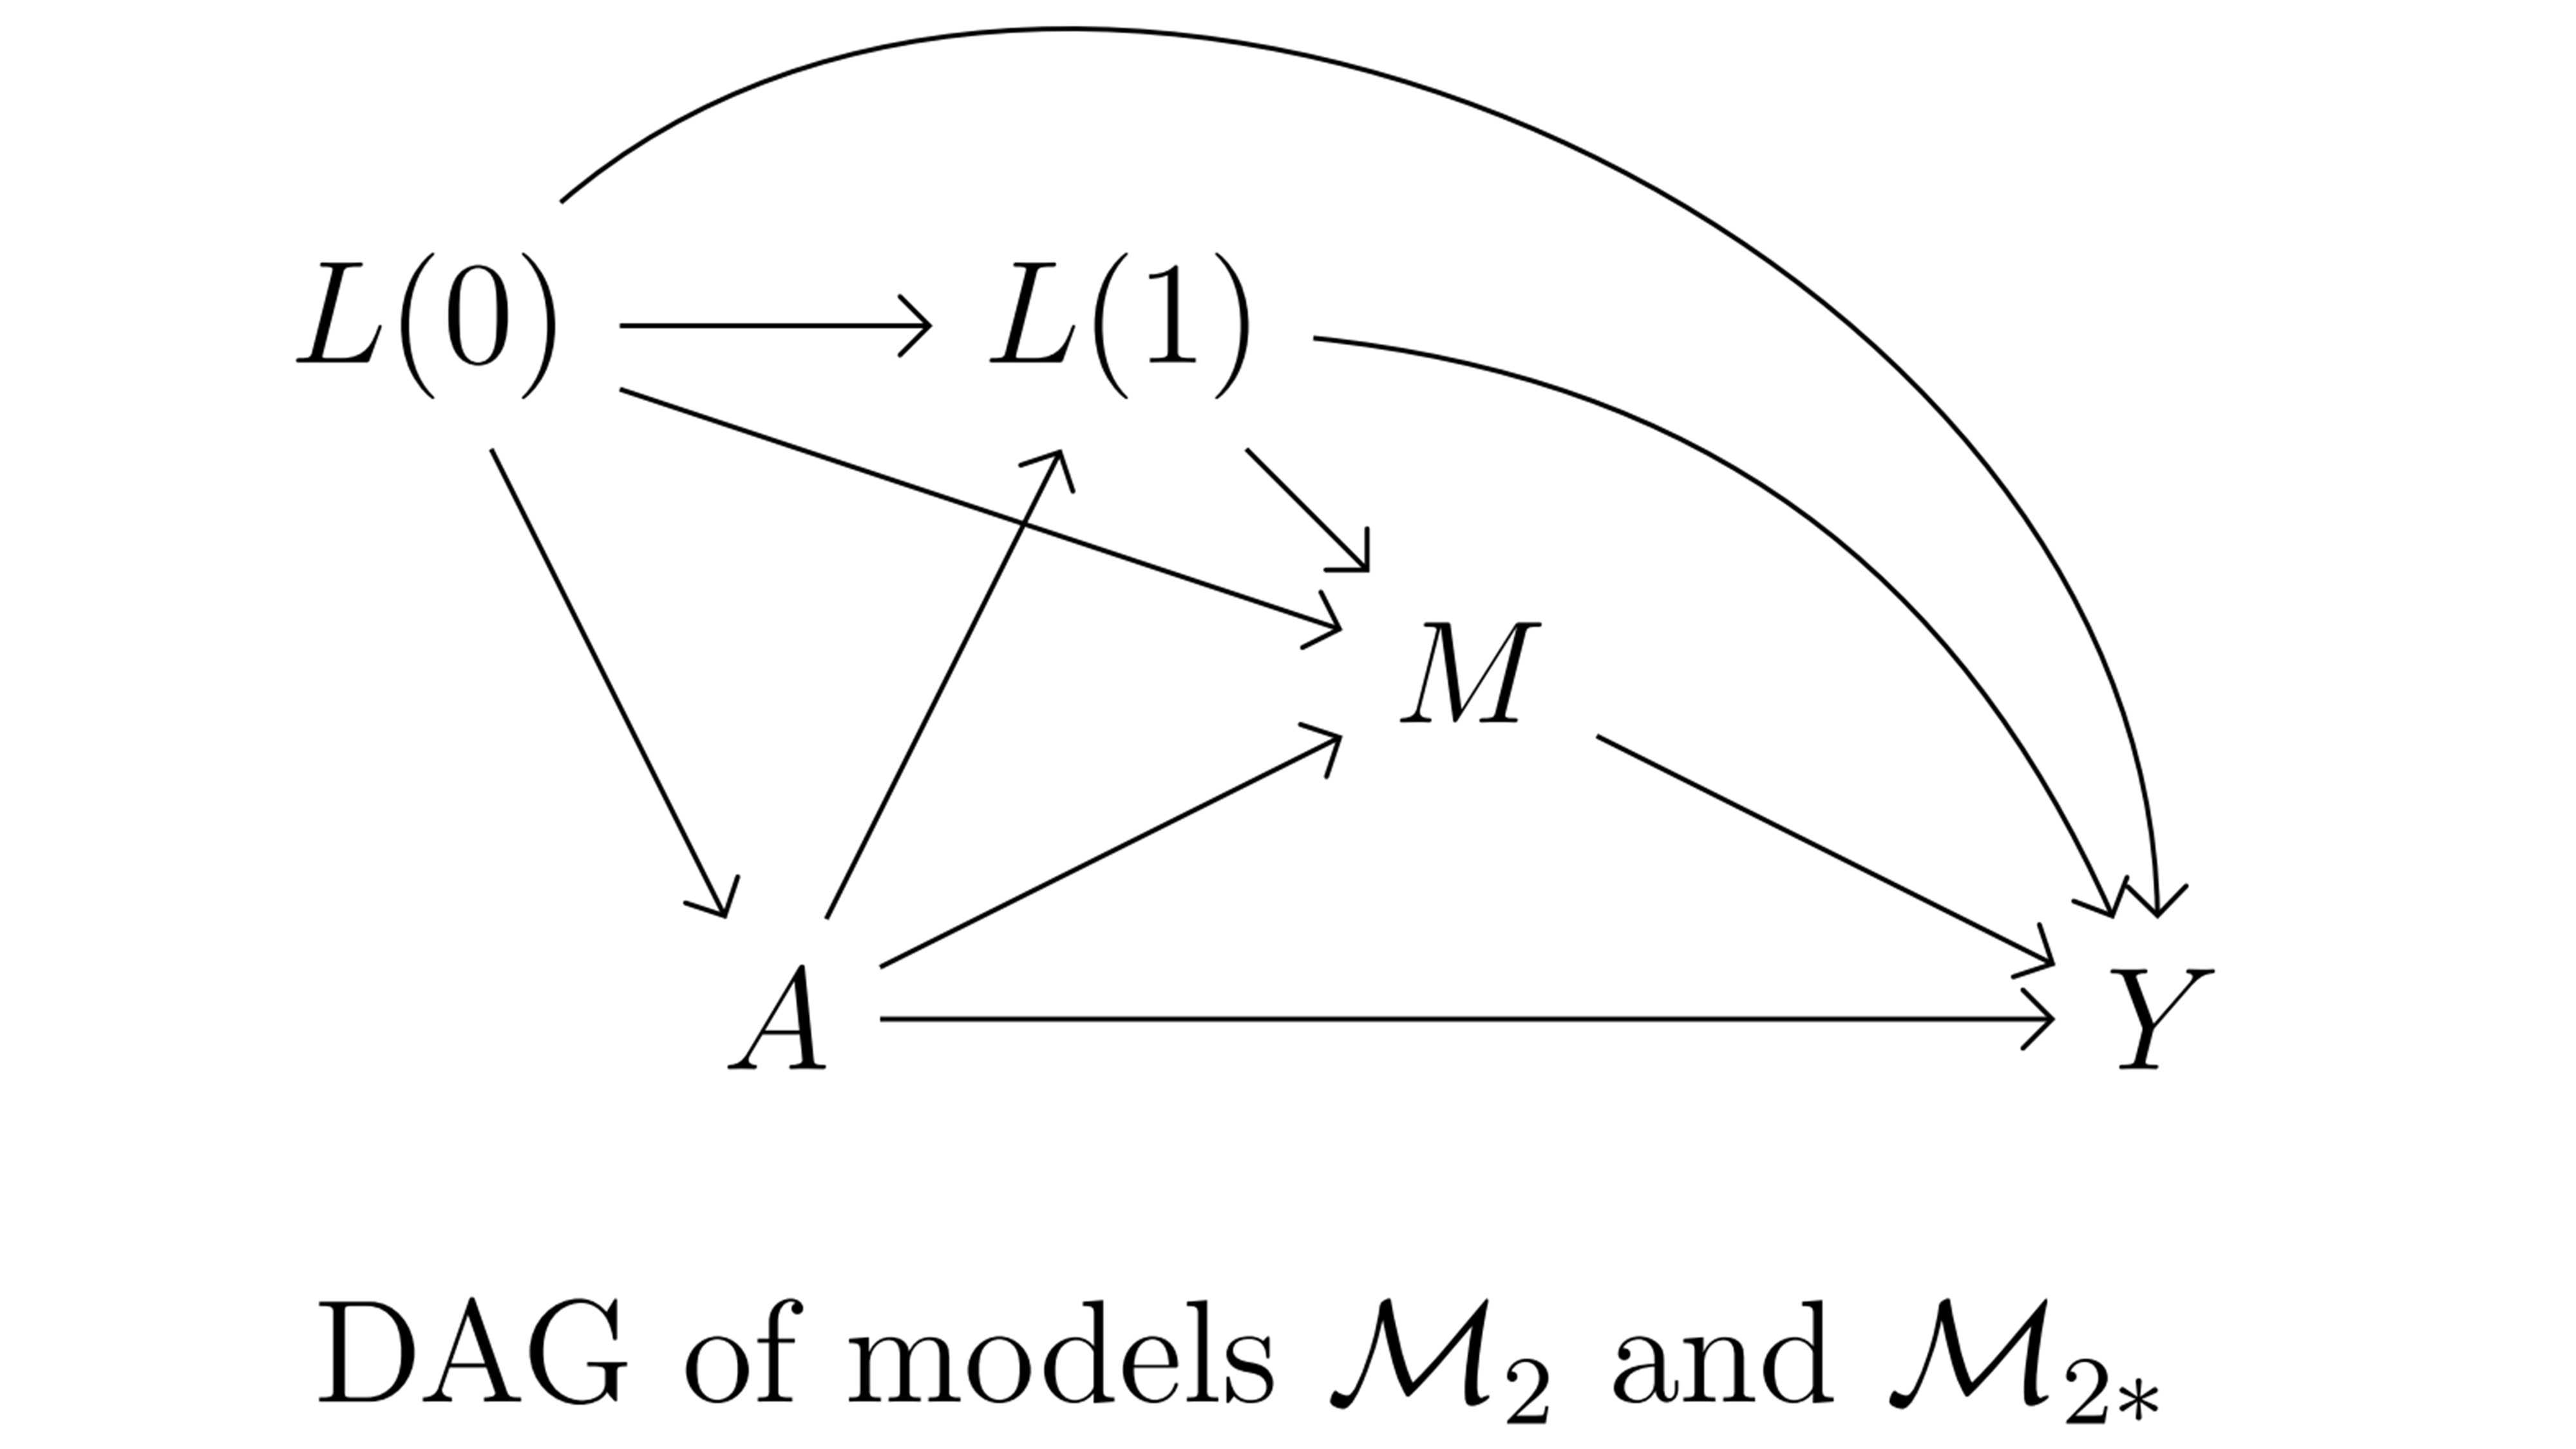
Figure 3.2: Causal model 2
The R functions used to simulate these 4 data sets are given in the Appendix A @ref(appendix_a).
The Appendix B @ref(appendix_b) describes how the true values for the estimands of the causal quantities of interest given in Table 2 of the Expanse “Mediation analysis” report were calculated. Those true values are the theoretical values expected under the causal and statistical models \(\mathcal{M}_1\), \(\mathcal{M}_{1 \ast}\), \(\mathcal{M}_2\) and \(\mathcal{M}_{2 \ast}\). Estimations that will be obtained from the data sets df1.csv, df1_int.csv, df2.csv, and df2_int.csv will be slightly different from the true values because of sample variability.